Twitter Analytics: How to Track and Grow on X in 2026

Over 500 million posts hit X every single day. Yet most creators and marketers publish without ever checking whether their content actually reaches anyone. Twitter analytics is the practice of measuring post performance, audience behavior, and engagement trends on X (formerly Twitter), and it has never been more critical than it is right now.
The platform is evolving fast. A 2026 study by Metricool, analyzing over 1.1 million posts, found that average impressions per post dropped 5% while engagement rose 19%. That means the algorithm is showing your content to fewer people, but rewarding quality with deeper interaction. If you are not tracking your numbers, you are flying blind in a space that punishes guesswork.
What Are Twitter Analytics and Why Do They Matter?
Twitter analytics refers to the suite of data tools and metrics that measure how your content performs on X. At the platform level, X provides a native dashboard covering impressions, engagement rate, link clicks, profile visits, and follower demographics. Third-party tools expand on this with historical trends, competitor benchmarking, and sentiment analysis.
Why should you care? Because the platform's dynamics have shifted. From 2024 to 2025, the X community posted 8% more, shared 35% more through retweets, and generated 21% more replies. At the same time, average impressions per post declined by 5.3%, dropping to just 2,711 views. The algorithm now favors tight, engaged audiences over broad reach. Without analytics, you cannot tell whether a dip in impressions is a problem or simply the new normal.
Understanding these metrics also protects your investment. The average X user spends 32 to 34 minutes per day on the platform. Competition for that attention is fierce. Data lets you identify what resonates and double down on it, rather than waste effort on content that vanishes into the feed.

Key Metrics You Should Track on X
Not all metrics carry the same weight. The ones that matter most depend on your goals, but a handful of data points deserve attention from every account.
- Impressions: The number of times your post appears in a feed. This tells you about reach, though as noted, reach on X is tightening.
- Engagement rate: Total engagements (likes, replies, retweets, link clicks) divided by impressions. Industry benchmarks hover around a 0.015% median, with sports teams reaching 0.073%.
- Retweets and reposts: The strongest signal of endorsement. Retweets jumped 35%, from an average of 4.93 per post in 2024 to 6.67 in 2025.
- Profile clicks: Shows how many users visited your profile after seeing a post. Profile clicks dropped 31%, falling from 8.29 per post in 2024 to 5.68 in 2025.
- Follower growth: Net new followers over time, factoring in both gains and losses.
- Link clicks and CTR: External link click-through rates fell from 1.8% in 2024 to 1.2% in 2026, reflecting the algorithm's preference for native content.
Tracking these together paints a complete picture. A post with low impressions but a high engagement rate, for example, signals that your audience loves the content; you just need wider distribution.
How to Access X's Native Analytics Dashboard
X offers built-in analytics at no cost. Here is how to find them.
- Log in to your X account on a desktop browser.
- Navigate to analytics.x.com (formerly analytics.twitter.com) or click "More" in the left sidebar, then select "Analytics."
- You will land on the Account Home dashboard, which shows a monthly summary of top posts, impressions, and follower changes.
From there, you can access two additional panels. The Post Activity Dashboard shows metrics for every individual post, including impressions, likes, replies, and retweets. You can filter by date range and export data as a CSV file. The Video Activity Dashboard provides retention rates, view counts, and completion rates for video content. Both dashboards let you toggle between organic and promoted results.
On mobile, tap the activity icon beneath any of your published posts to see a quick snapshot of impressions and engagements. The full dashboard experience, however, is best accessed on desktop.
Why Native Analytics Alone Are Not Enough
X's built-in tools cover the basics, but they have blind spots. Native analytics do not offer competitor comparisons, sentiment tracking, or AI-driven content recommendations. They also lack historical data beyond a limited window, making it difficult to spot long-term trends.
This gap matters more in 2026. With external link CTR compressing to 1.2%, brands need native content strategies built on deep insight, not surface-level metrics. Understanding which topics spark replies versus which drive retweets requires layered analysis that the built-in dashboard simply does not provide.
That is where dedicated analytics platforms come in. Our community-driven approach to growing your audience on X includes a smart analytics dashboard that tracks post performance and engagement patterns. Instead of toggling between spreadsheets and browser tabs, you get a single view of what is working and why.
The Engagement Shift: What the 2026 Data Tells Us
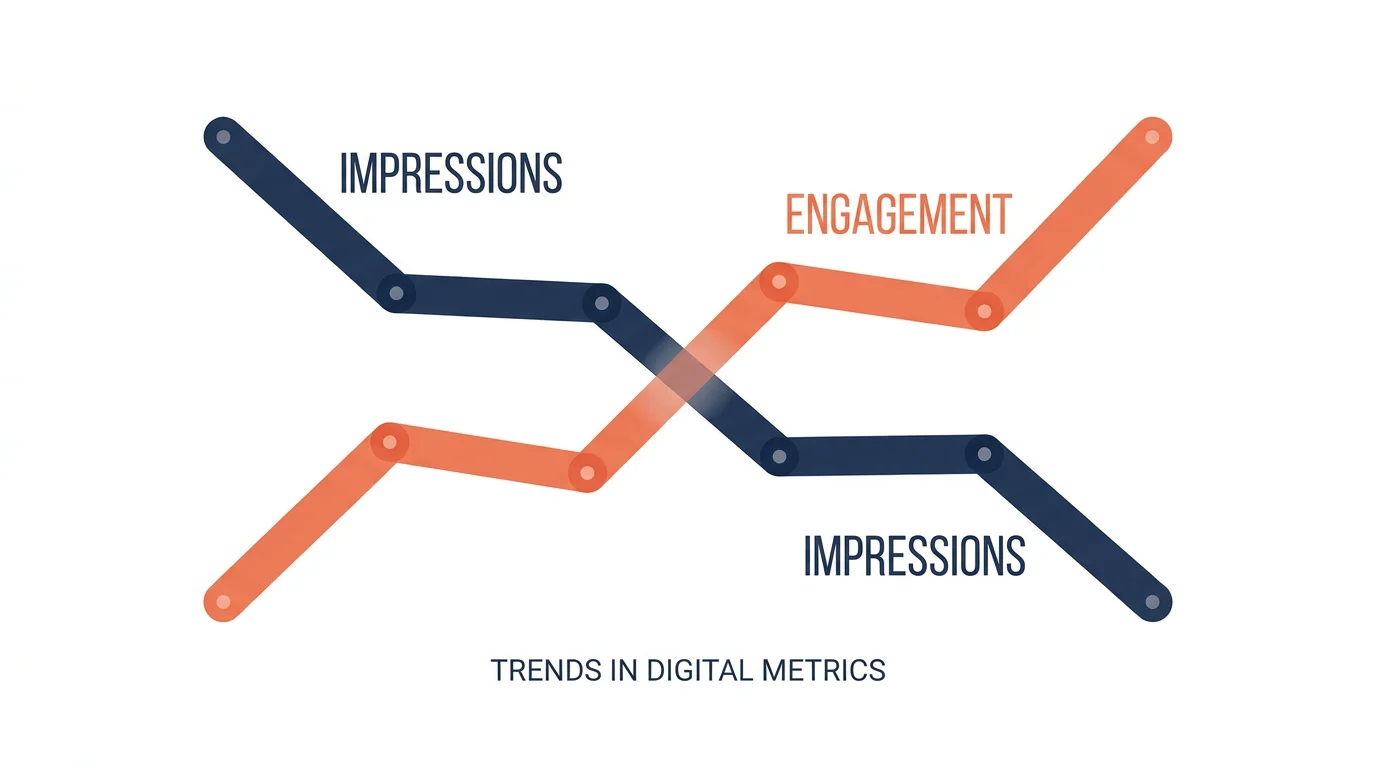
The most important story in X analytics right now is the divergence between reach and interaction. Impressions are shrinking while engagement is climbing. This is not a contradiction; it is a design choice by the algorithm.
The statistical divergence points to an algorithmic tightening that restricts broad visibility. The system now delivers content to smaller, but highly reactive, targeted audiences. For creators and brands, this means vanity metrics like follower count and raw impressions tell an incomplete story.
Likes grew 8% year over year but at a slower pace than retweets or replies. In 2026, a "Like" is considered a low-effort interaction; it averages 32.89 per post yet no longer drives the "For You" feed as strongly as retweets or replies. The takeaway: if your analytics show rising retweets and replies but flat impressions, you are actually winning under the current algorithm.
This shift rewards community-driven growth strategies. When real accounts repost your content, the algorithm treats it as a high-quality signal and distributes it further. We built our AI-powered engagement community around exactly this principle, matching your posts with verified users whose interests align with your content.
Video, Creators, and the Metrics That Pay
X users watched 8.3 billion videos daily in 2024, a 40% year-over-year increase, and that momentum has continued. Video retention and completion rates, available in X's Video Activity Dashboard, are now among the most important metrics for creators in the platform's revenue-share program.
X paid out $415 million to creators in 2025, up from $260 million in 2024. However, the top 1% of monetized creators earn over $52,000 per year while the median monetized account earns under $400 annually. The revenue model rewards engagement velocity, not follower count. Creators who track their analytics closely can identify which formats generate the fastest interaction loops and lean into them.
For those not yet in the revenue program, video analytics still matter. Posts with video consistently outperform text-only updates in engagement rate. Monitoring completion rates tells you whether your audience watches to the end or drops off early, which is actionable data you can use to refine length and pacing.
Choosing the Right Analytics Strategy for Your Goals
Your approach to analytics should match your objectives. Below is a comparison of common methods.
| Approach | Best For | Key Strength | Limitation |
|---|---|---|---|
| X Native Dashboard | Basic monitoring | Free, real-time data | No competitor insights or AI recommendations |
| Manual CSV Exports | Custom reporting | Full data control | Time-intensive, no automation |
| Third-party Analytics Tools | Agencies, multi-account | Historical data, benchmarks | Can be costly, data lag possible |
| Xarmy Smart Analytics | Creators, startups, SMBs | AI matching + real engagement data in one view | Focused on X (single platform) |
For solo creators and startup founders, the most efficient path combines native analytics for raw data with a tool that adds context. Our smart analytics dashboard surfaces patterns in your engagement, such as which topics attract reposts from verified accounts, so you can refine your content calendar without spending hours on spreadsheets.
Practical Tips to Improve Your Numbers
Data without action is just noise. Here are evidence-based steps to translate your analytics into growth.
- Post more frequently. The average number of weekly posts grew 8% in 2025, rising from 15.97 to 17.34. Staying at or above this pace keeps you competitive.
- Prioritize native content. Since external link CTR is declining, write threads, share images, and post videos directly on X rather than linking out.
- Engage in replies. Replies grew 21% year over year. Participating in conversations signals to the algorithm that your account adds value.
- Optimize posting times. Top engagement windows fall on Tuesdays through Thursdays between 9 a.m. and 3 p.m. Check your own analytics to confirm these windows for your audience.
- Use hashtags strategically. Hashtags can increase engagement by up to 21%. Limit yourself to one or two relevant tags per post.
- Track retweets over likes. Retweets are the primary driver of viral loops in 2026. Focus your analytics review on repost patterns.
Consistent measurement turns these tactics from guesses into a system. Review your analytics weekly, note what moved the needle, and adjust.
Frequently Asked Questions
Is Twitter analytics free to use?
Yes. X provides a native analytics dashboard at no cost to all users. You can access it at analytics.x.com on desktop or view individual post metrics via the activity icon on mobile. For deeper insights like AI-driven recommendations and community engagement tracking, our smart analytics dashboard offers a free tier as well.
What is a good engagement rate on X in 2026?
The median engagement rate across all accounts is approximately 0.015%. Rates vary significantly by niche; sports accounts average around 0.073%. An engagement rate above 0.05% is generally considered strong for most industries.
How often should I check my X analytics?
A weekly review is sufficient for most creators and small teams. Check impressions, engagement rate, and follower trends each week. For campaign launches or product announcements, monitor performance daily for the first 48 to 72 hours to catch early signals.
The data is clear: X in 2026 rewards creators who pay attention to analytics on Twitter and adapt to the platform's tightening algorithm. Impressions may be contracting, but the value of each engaged viewer is rising. The accounts that win are the ones that track, test, and iterate. Rather than guessing, let real engagement data guide every post. With AI-powered matching and a community of over 10,000 active creators, we make it easier to turn analytics into growth. Start with our free AI-powered engagement community and see what your numbers can become.